rki.news
Washington, D.C. — Former U.S. President Donald Trump’s first 100 days in office remain one of the most scrutinized periods in modern American politics. An analysis through eight revealing charts captures the dramatic shifts, bold promises, and controversial decisions that marked the early phase of his presidency.
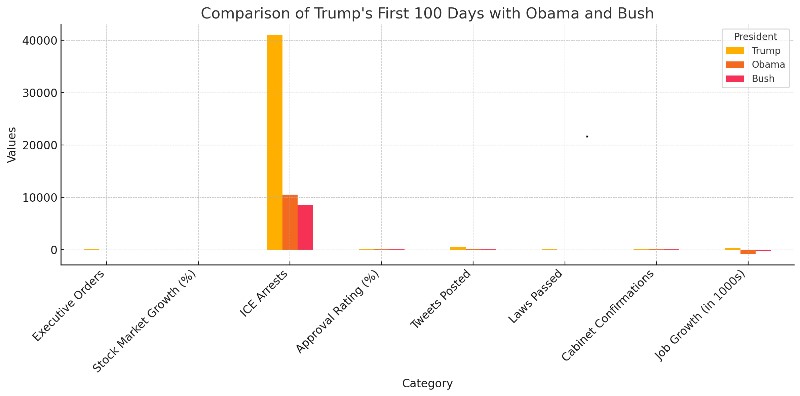
From sweeping executive orders to unconventional policy shifts, Trump’s opening days in the White House broke with many presidential norms. The charts highlight key developments in areas such as immigration, economic growth, stock market response, public opinion, executive action, and legislative efforts.
One chart shows a historic surge in executive orders—far surpassing his predecessors—while another illustrates the sharp political polarization reflected in public approval ratings. Trump’s approval stood at a historically low level for a new president, yet he maintained strong support among his base.
Economically, the markets responded optimistically, with the Dow Jones industrial average showing an upward trend, buoyed by promises of tax cuts and deregulation. However, job growth and GDP indicators suggested continuity rather than a major acceleration.
On immigration, his travel bans and border control policies sparked nationwide protests and legal battles. Another visual details the unprecedented pace at which the administration targeted regulatory rollback, reflecting his vow to “drain the swamp.”
Despite Republican control of Congress, Trump struggled to pass major legislation in his first 100 days, including the failure to repeal the Affordable Care Act.
Together, the charts underscore a presidency that defied expectations—marked by aggressive messaging, disruptive policymaking, and a redefinition of presidential communication via social media.
At 'Your World in Words,' we share stories from all over the world to make friends, spread good news, and help everyone understand each other better.
© 2026
Rahbar International
Leave a Reply